Sound Blog
So You Want to Learn R?
Thinking about learning R and where to start? Here’s my answer for you—a non-programmer and a curious diver.
Mastering Programming as a Non-Programmer Clinician: A Task-Oriented Approach
A task-focused guide for clinicians to learn programming efficiently, inspired by medical training and practical needs.
How Beginners Can Tap Into the R Community Effectively
Navigating the R community doesn’t have to be daunting. By asking clear questions, mastering tools like reprex, and leveraging forums and help files effectively, you can unlock a world of support and learning.
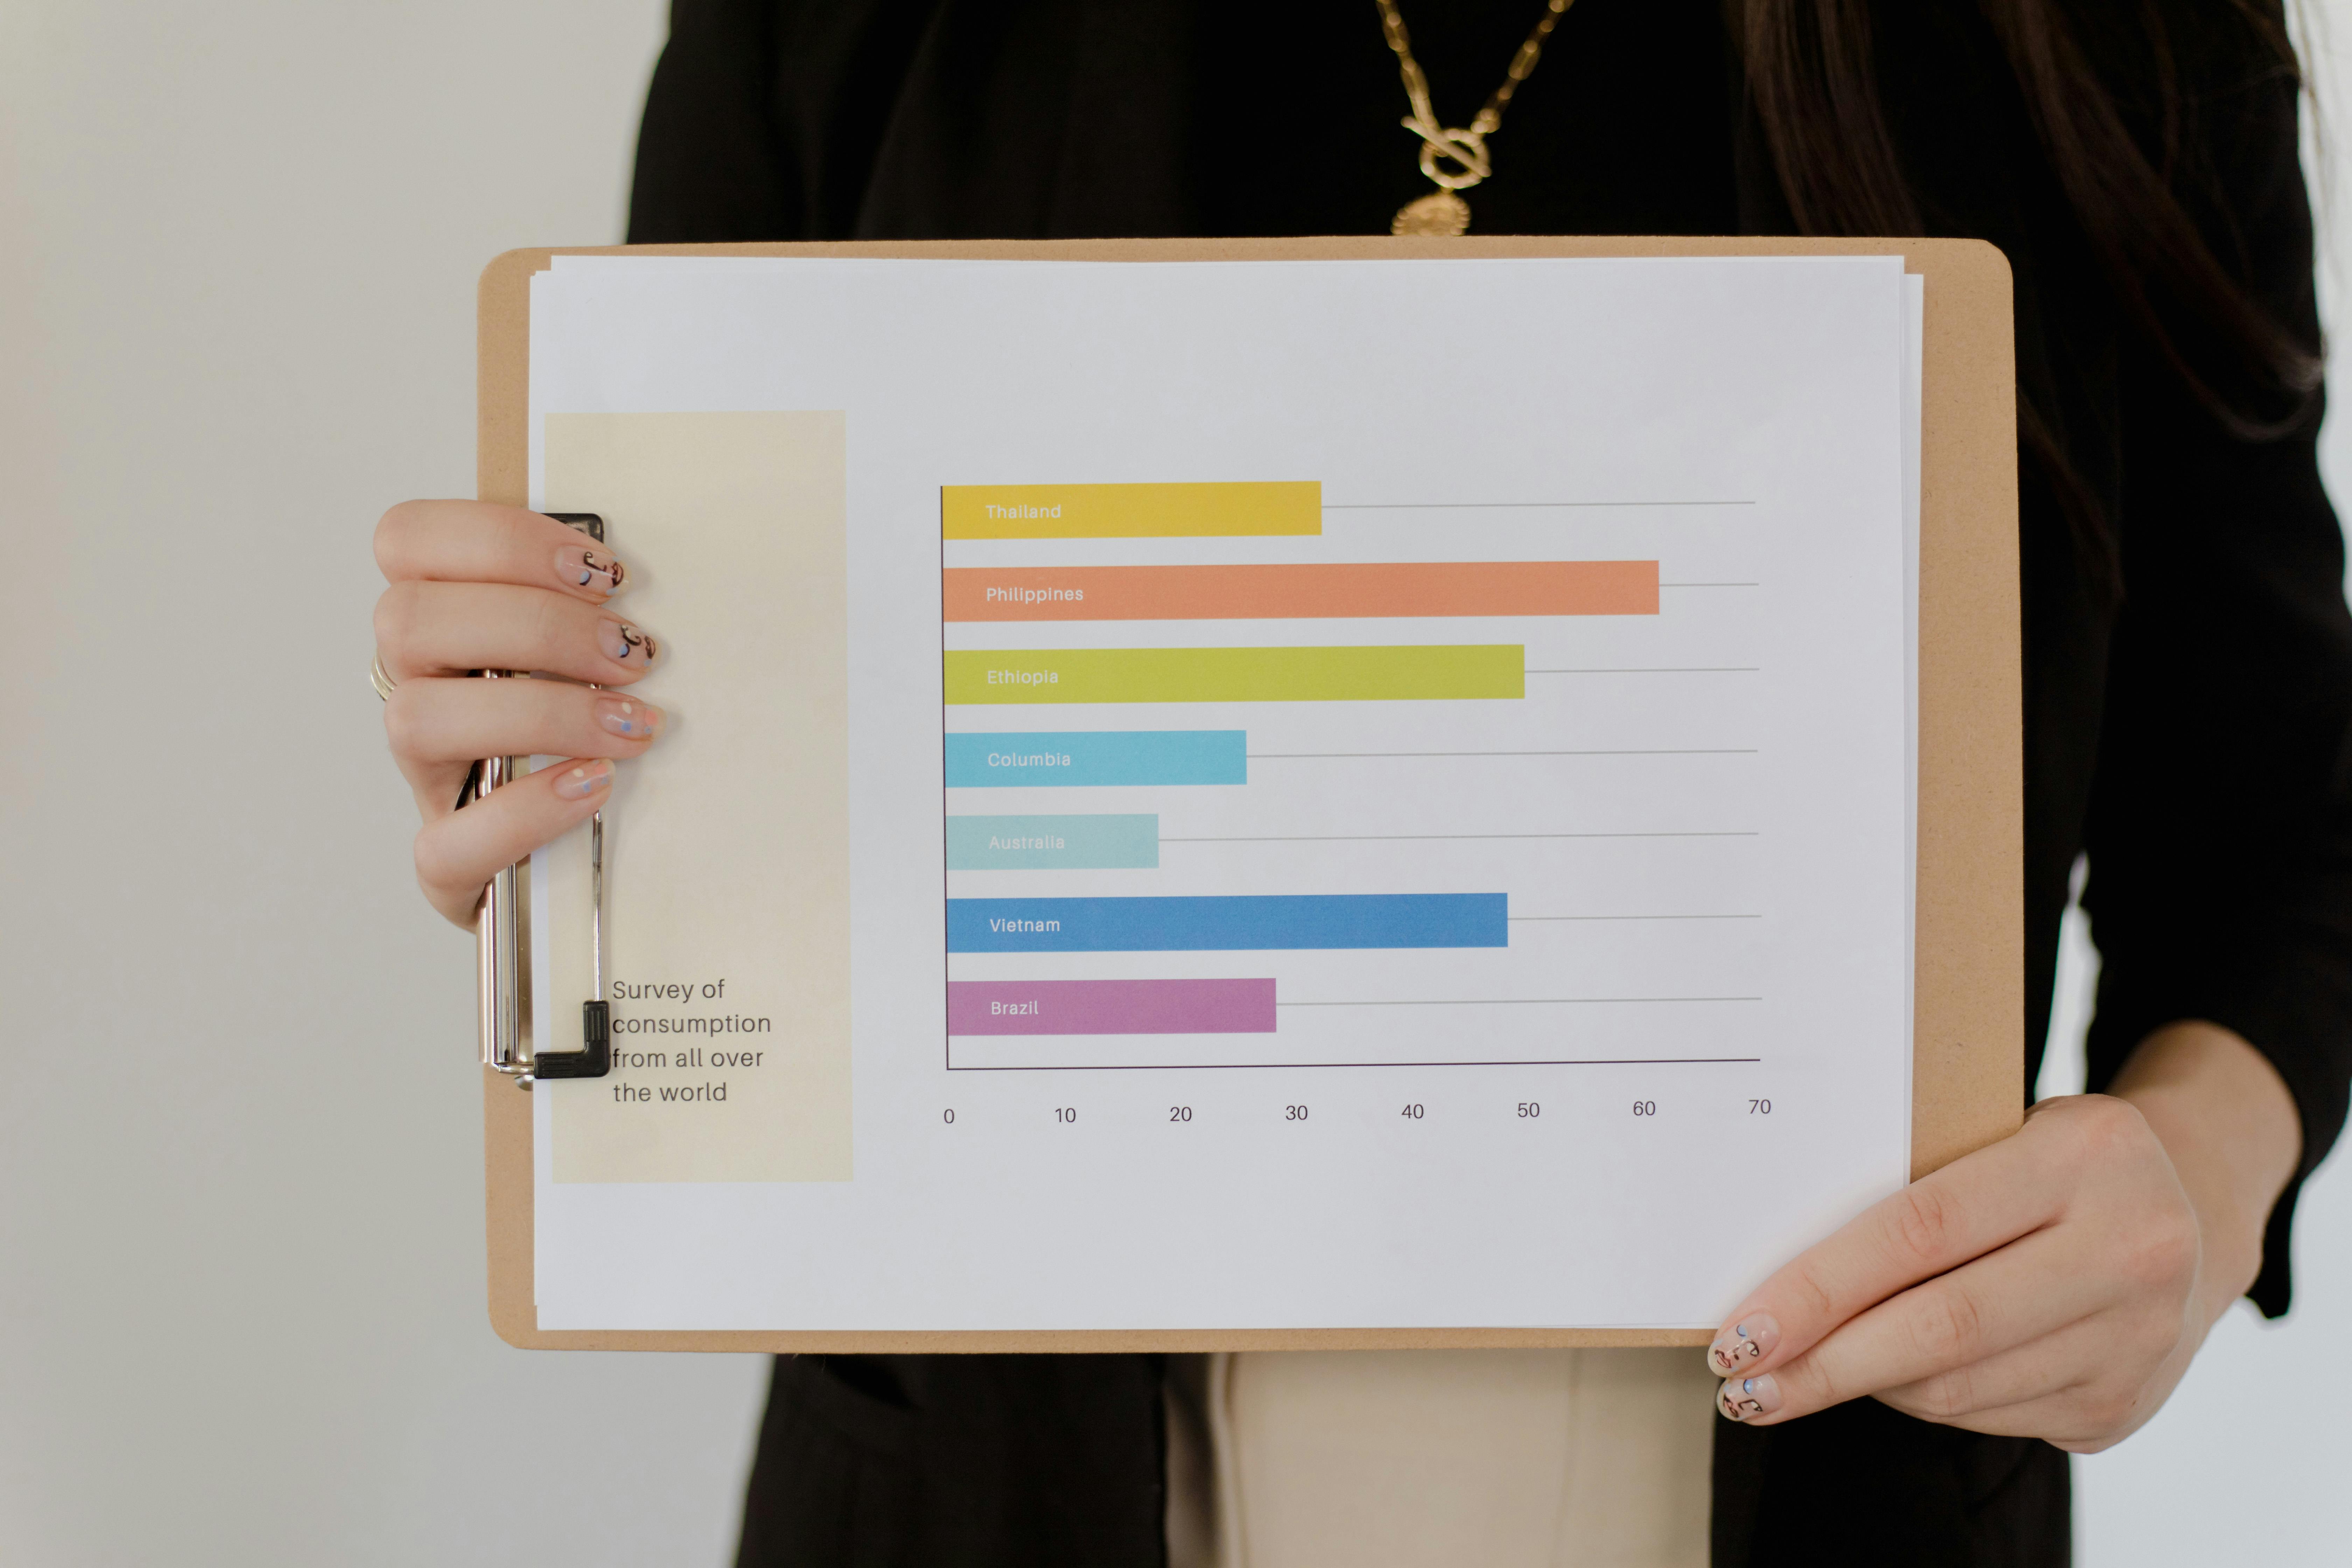
From Raw Data to Analyzable Data: 5 Simple Steps for Beginners
Learn a streamlined, beginner-friendly approach to transform raw data into clean, analyzable data in R.

Day 30 of viz with me
Recap of the series.
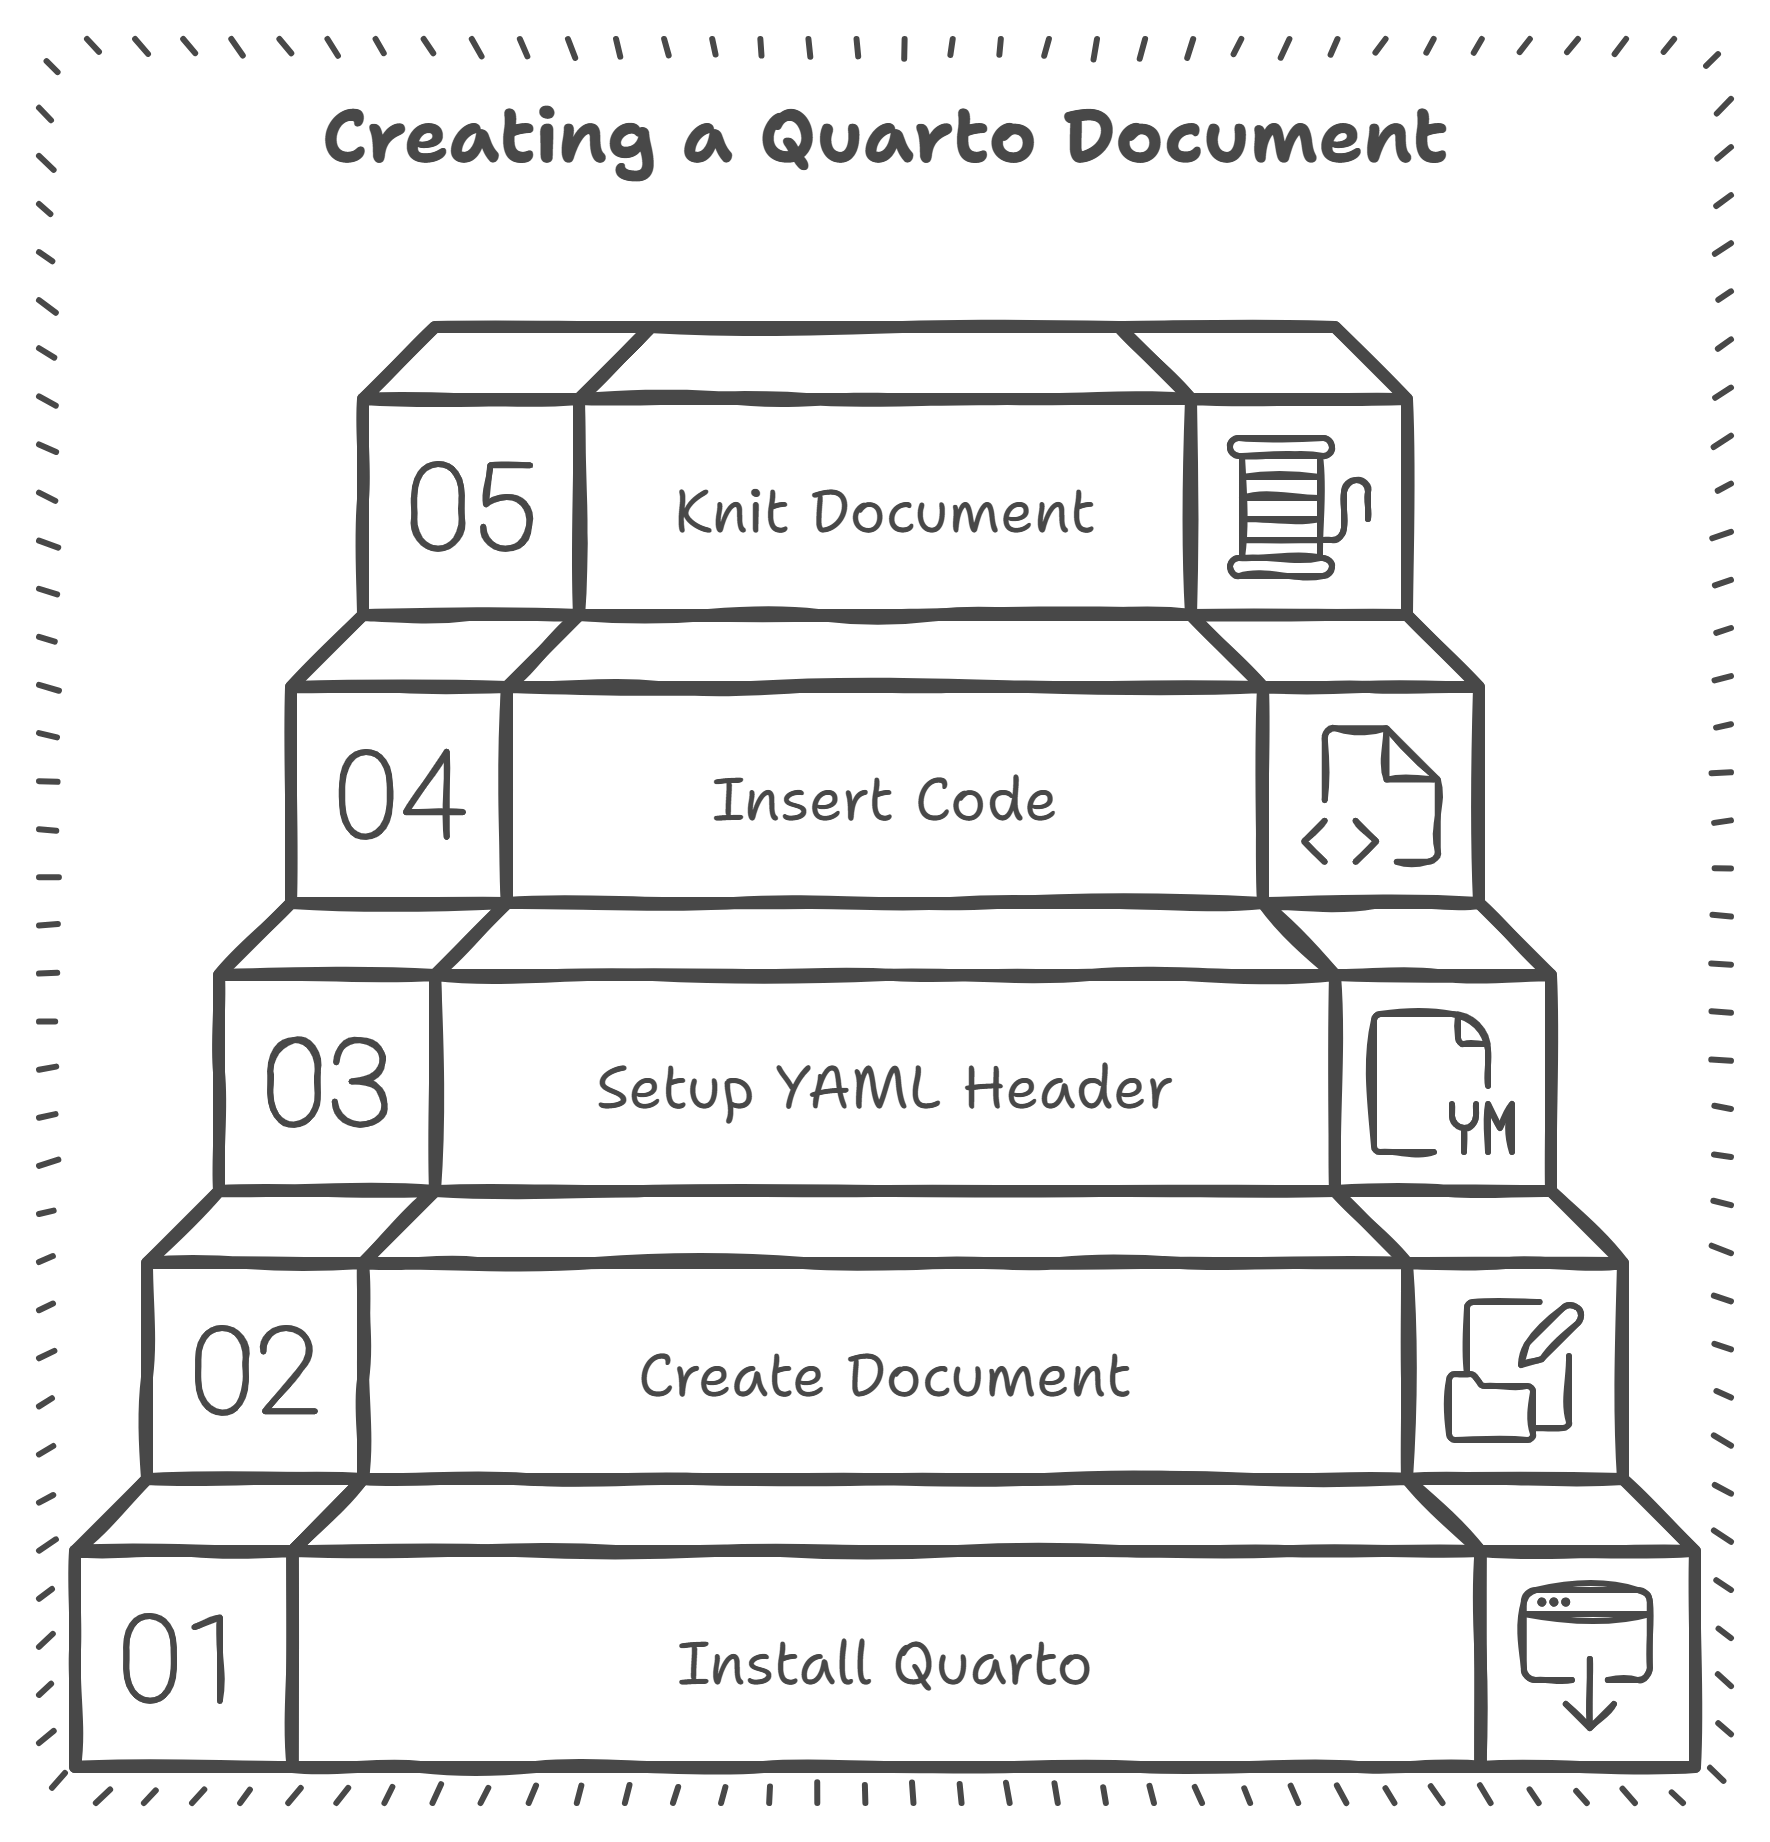
Day 29 of viz with me
A reproducible document of all that we learnt.

Day 28 of viz with me
An add-in for effortless dataviz with a video demo.

Day 27 of viz with me
Using custom colors.
Day 26 of viz with me
Import your own data and viz it!

Day 25 of viz with me
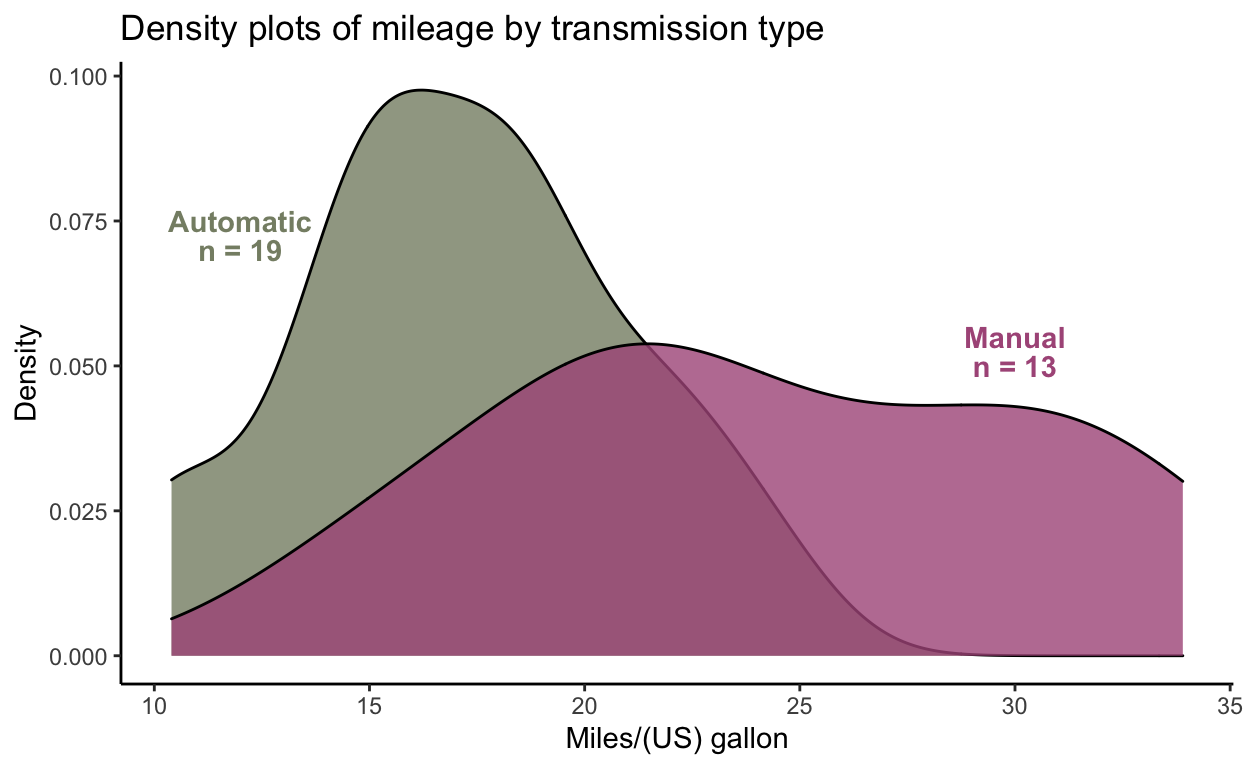
Rainclouds!!!!
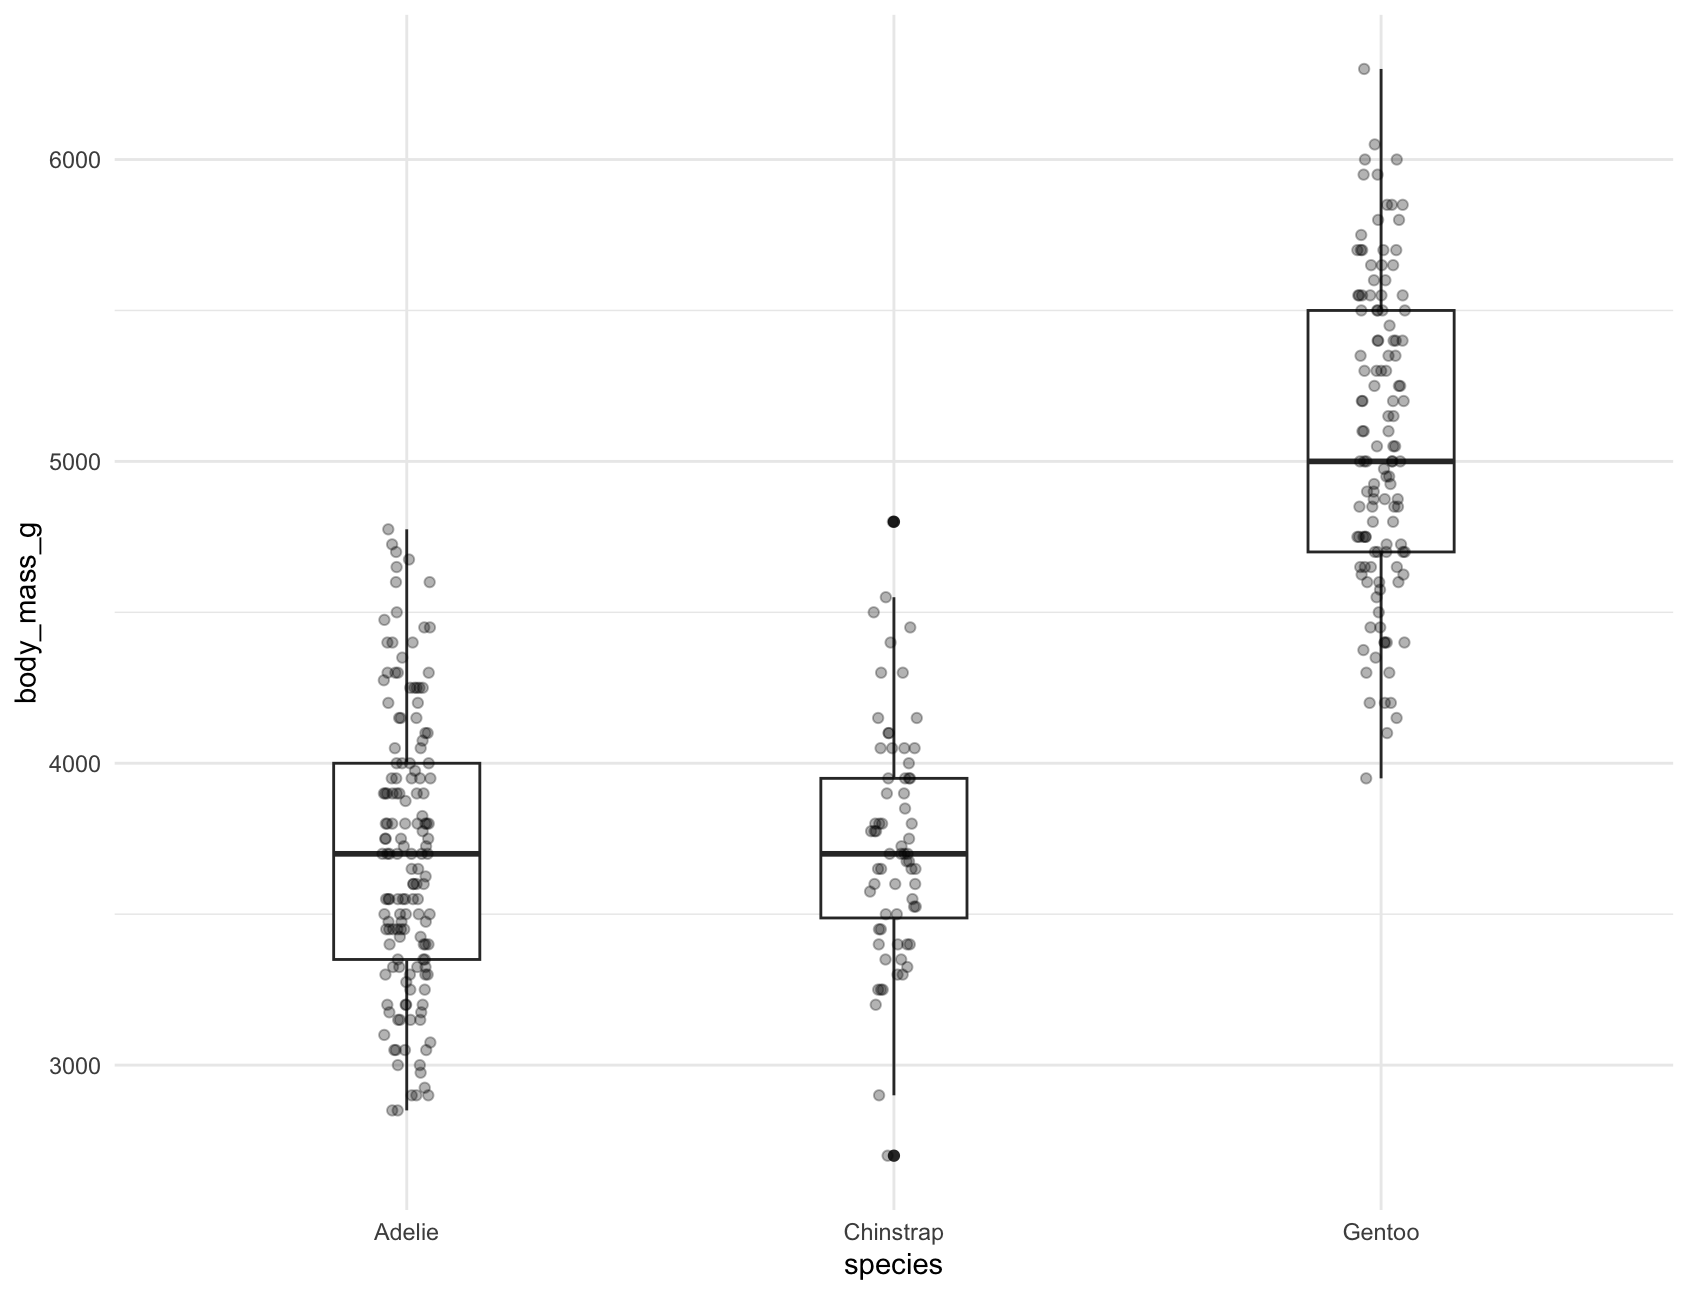
Day 24 of viz with me
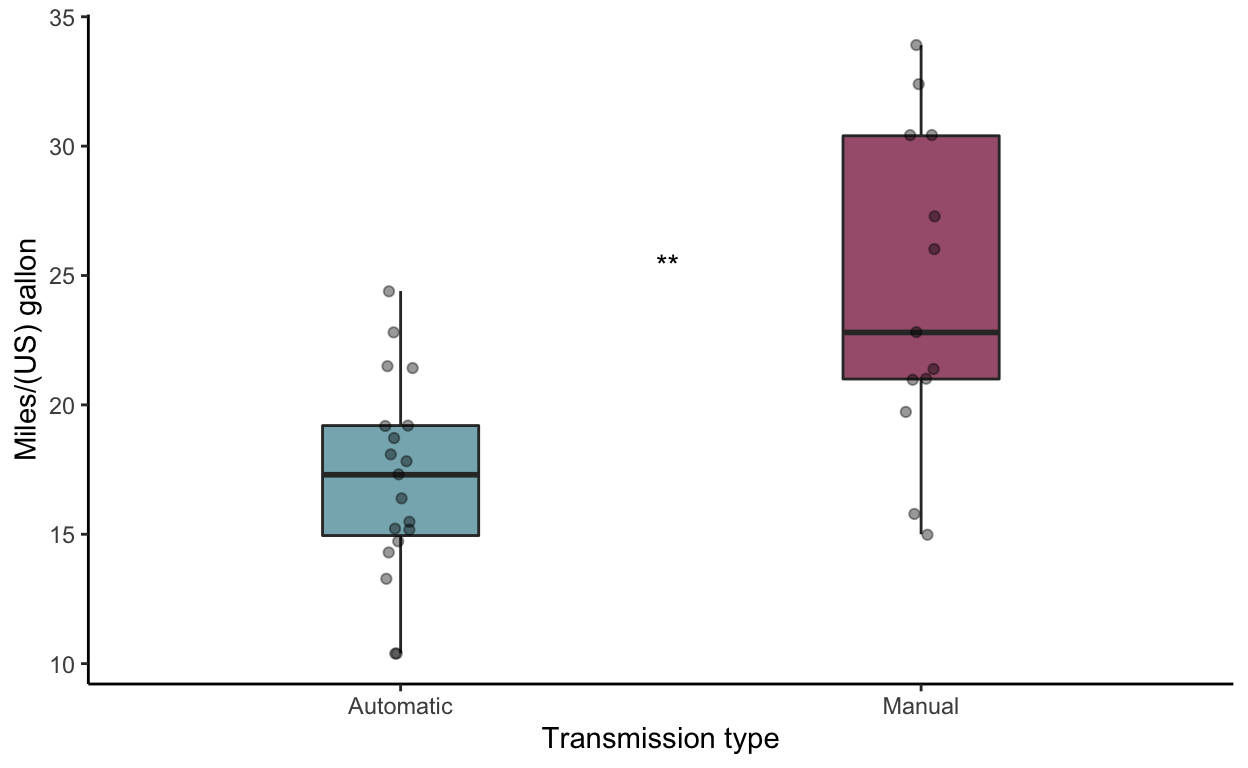
Boxes+jitter & Boxes+violins
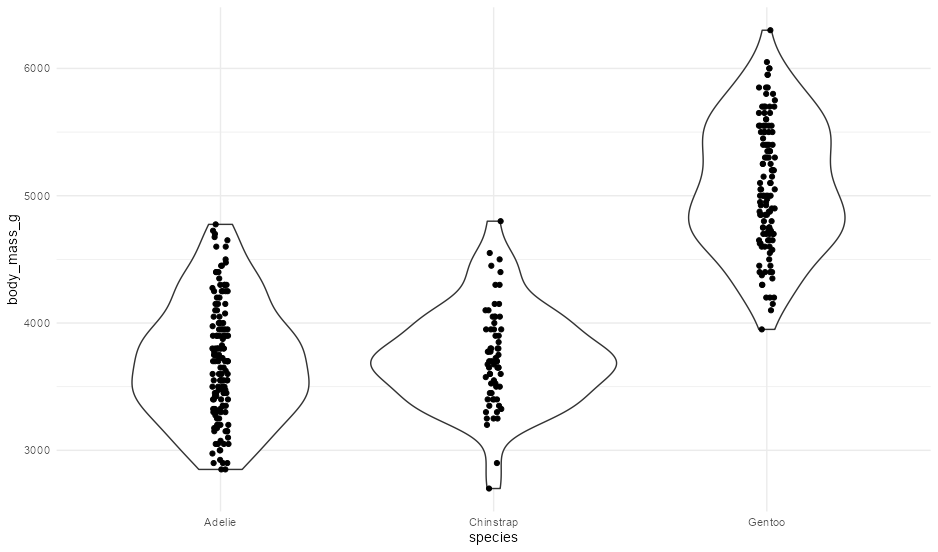
Day 23 of viz with me
Combining violin plots with jittering to reveal full spread of data points

Day 22 of viz with me
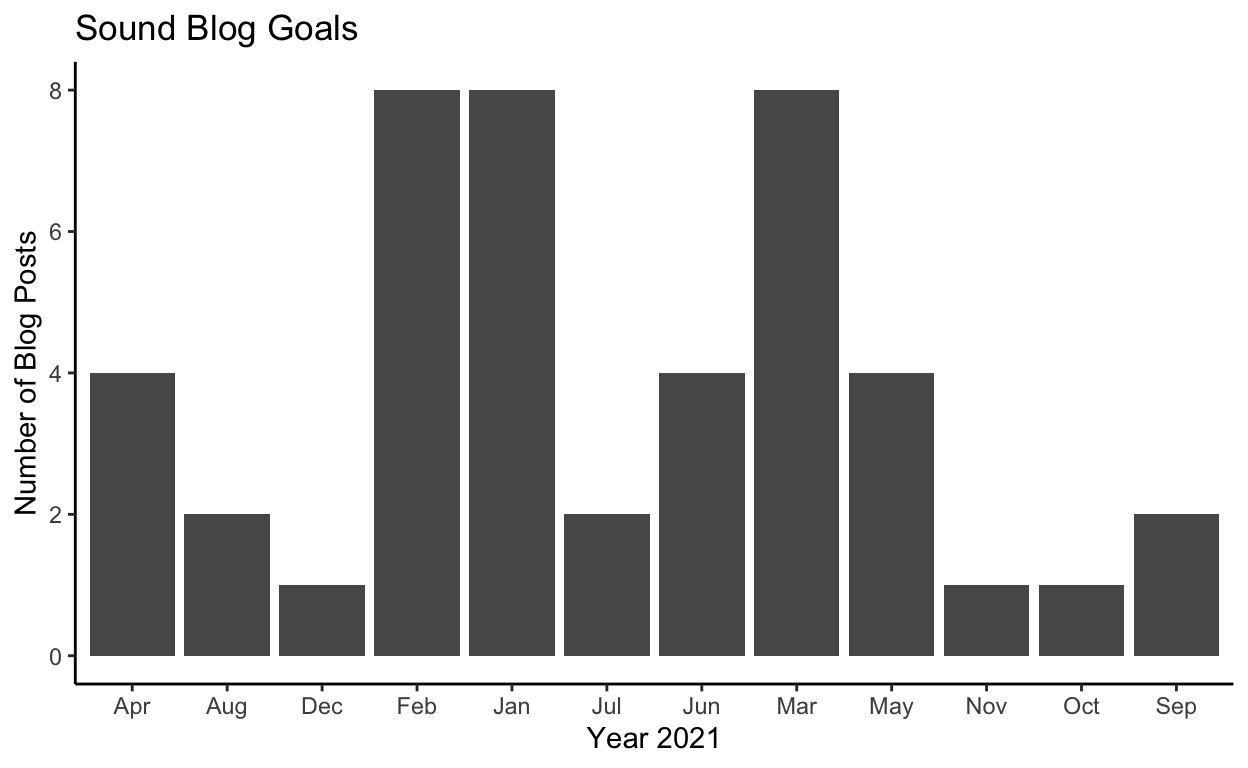
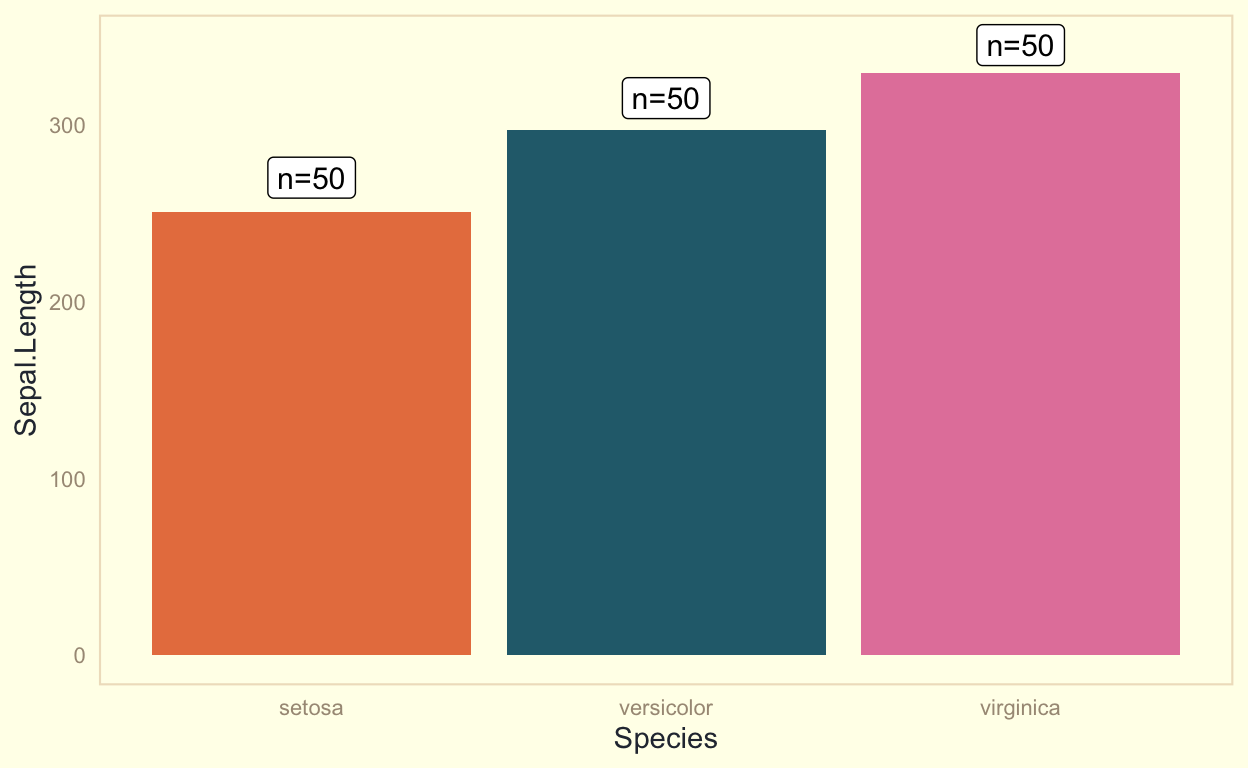
Exploring bar plot alternatives.
Day 21 of viz with me
Solution to yesterday's challenge.
Day 20 of viz with me
Exercise to revisit all learnt so far.
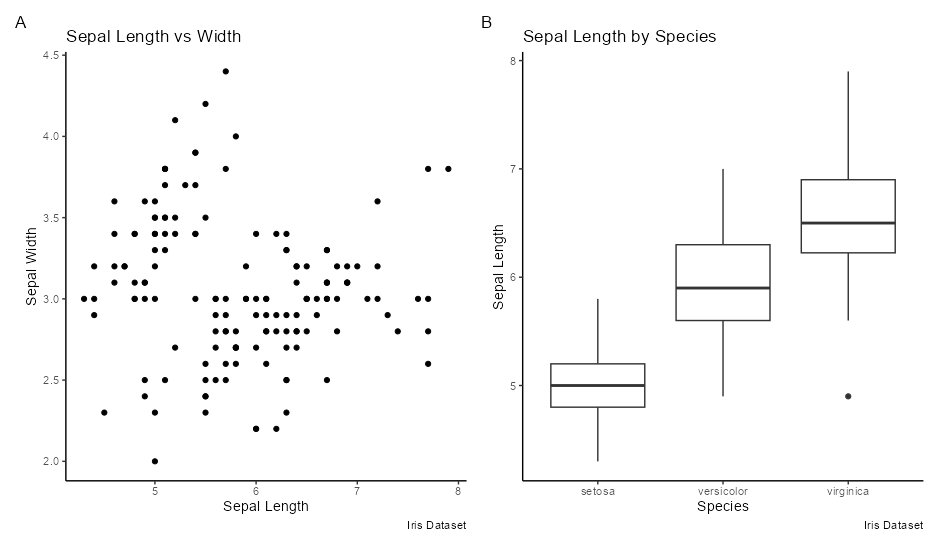
Day 19 of viz with me
Combining plots.
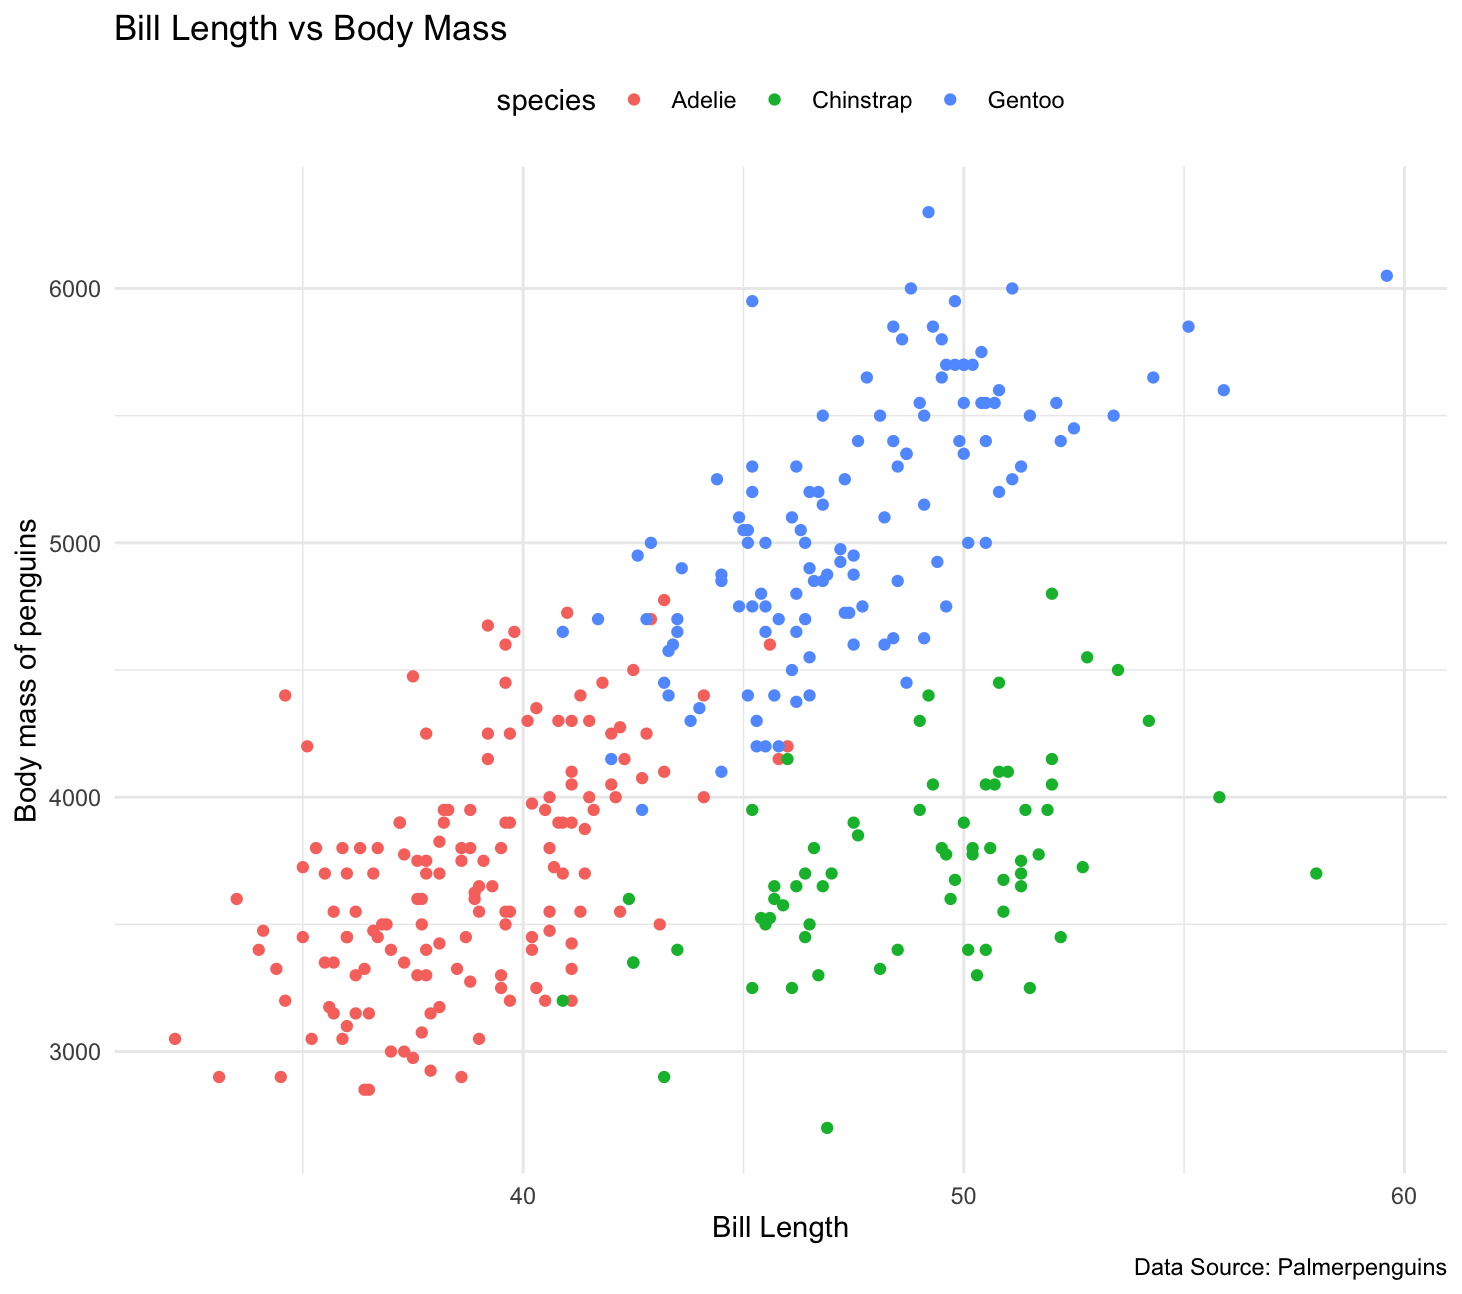
Day 18 of viz with me
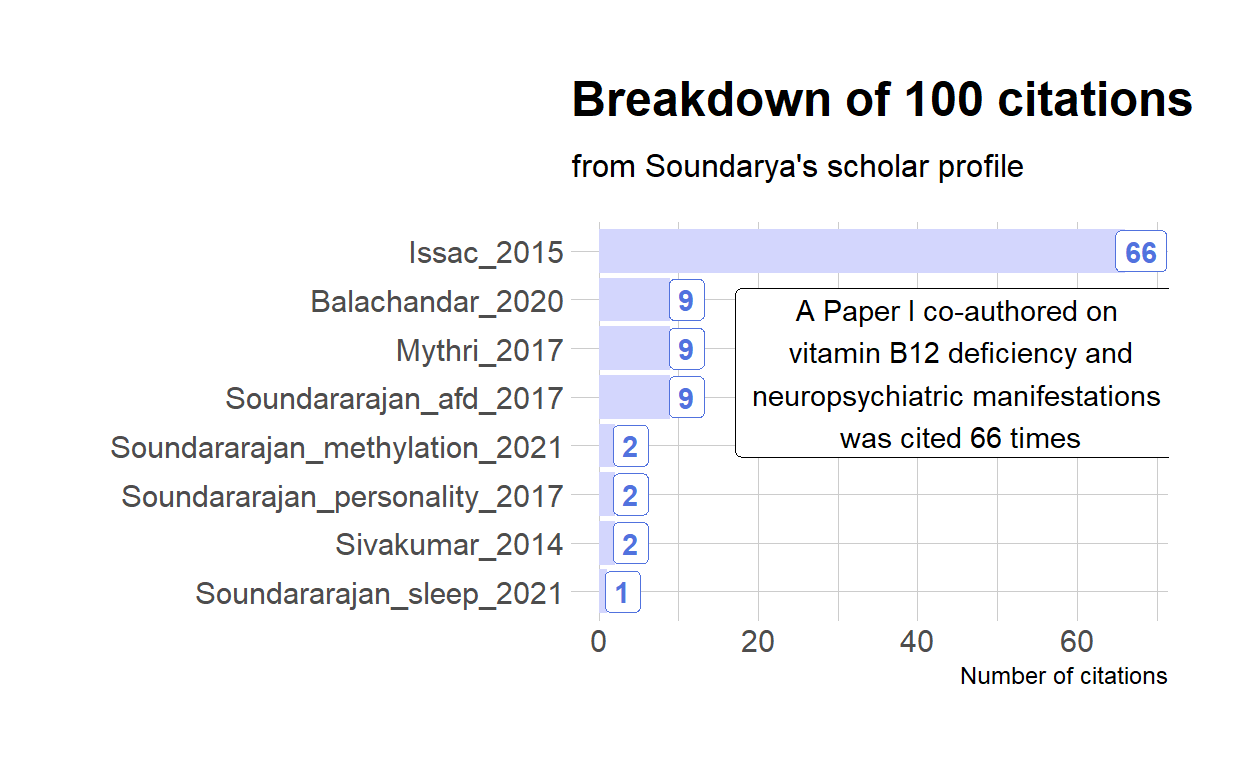
We will annotate our plots today.
Day 17 of viz with me
We learn to play around with text size in the plots today.

Day 16 of viz with me
We learn to save the plots today.
Day 15 of viz with me
Solution for yesterday's exercise and a few twists.

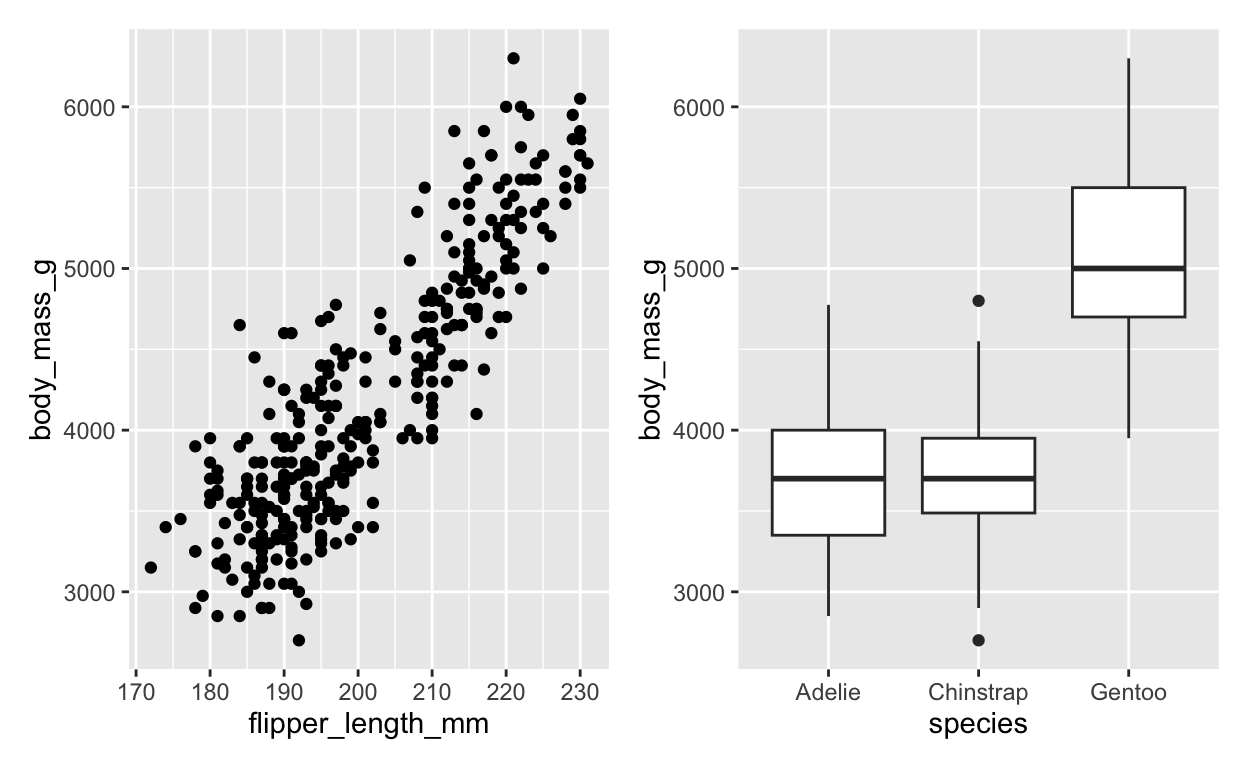
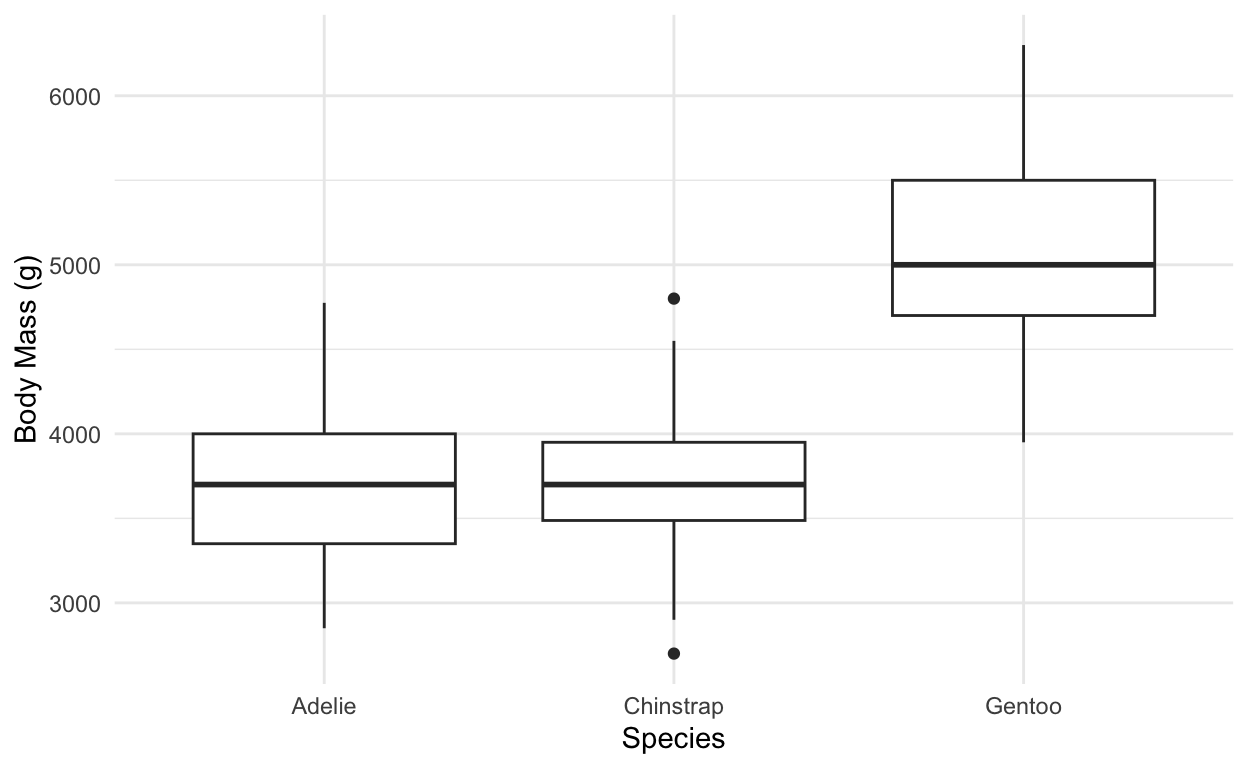
Day 14 of viz with me
An exercise with a new geom for boxplots.
Day 13 of viz with me
Today we will move the legends around.
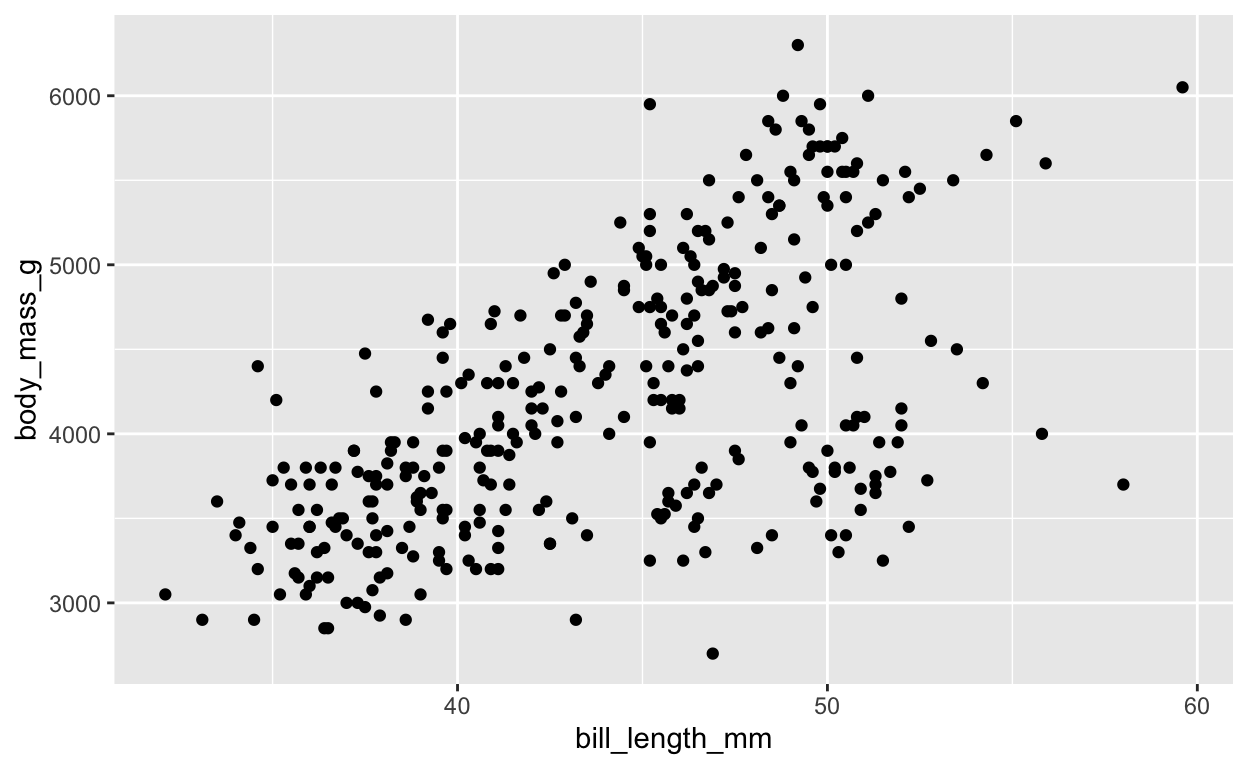
Day 12 of viz with me
Today we learn how to adjust axis limits.
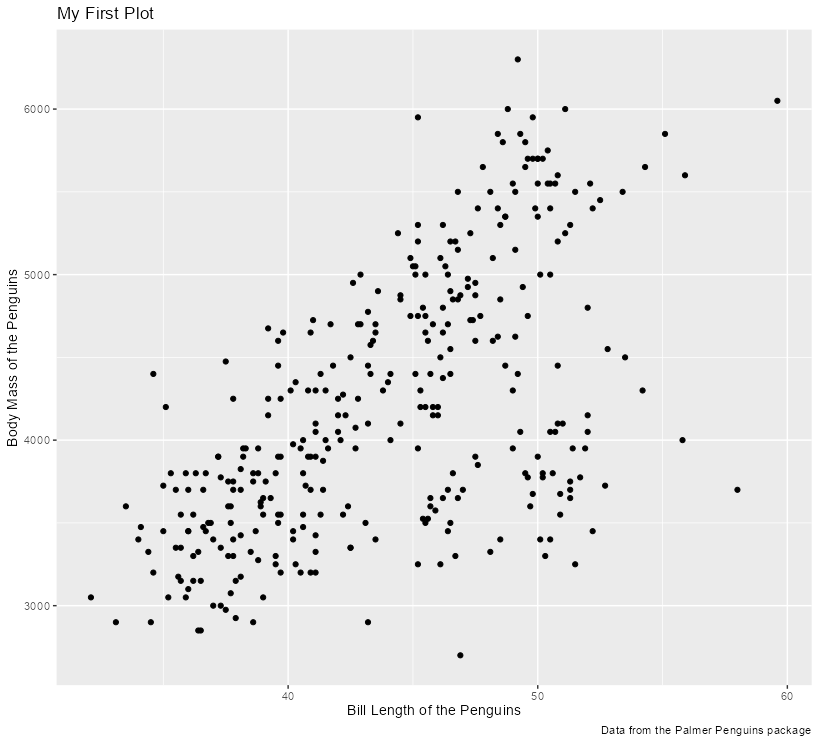
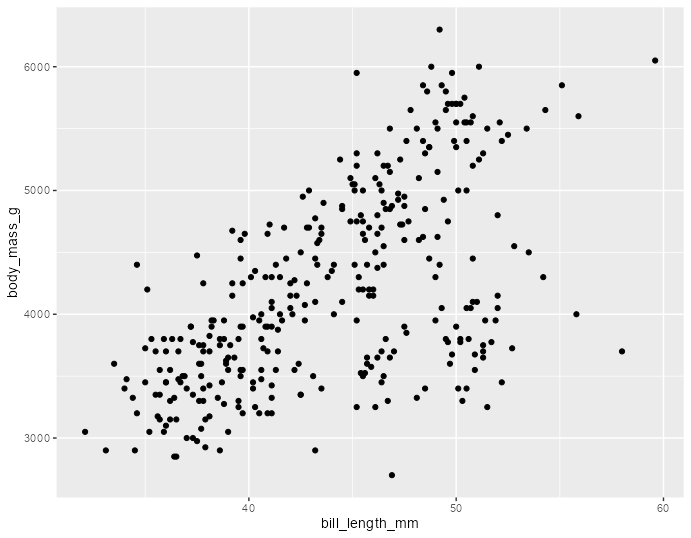
Day 11 of viz with me
Today we will create polished charts.